Envisioning a changed world

J. Ronald Eastman remembers arriving at Clark University in 1981 as a visiting professor. The chair of the Geography Department handed him a computer – the first one in the department – to use in cartography classes.
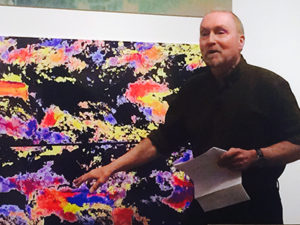
 “It looked like a glorified Etch-a-Sketch screen,” recalled Eastman (pictured). “Nobody knew what to do with it. There was no software.”
Within two weeks, Eastman had developed a course where students wrote computer programs to draw and digitize maps.
“That was the start of a long tradition at Clark of developing software for geographic applications,” he recently told an audience gathered for the opening of his “geoEnvisioning” exhibit, a display of computer-generated images predicting and assessing the impact of humans on the environment. “In geography, computers have become pretty indispensable for many aspects of the discipline.”
Part of the Higgins School of Humanities’ “What’s Next?” series exploring how humans envision and understand the future, Eastman’s exhibit is co-sponsored by Clark Labs. It runs through May 11 in Dana Commons’ Higgins Lounge.
Over the last 35 years, Eastman has become an internationally recognized expert in geographic information system (GIS) and remote sensing software and how to employ such tools to better understand the sweeping changes in the landscape and environment. He has mentored many graduate students, who have worked closely with him in developing and using the tools.
He’s now professor of geography and director of Clark Labs, where he developed the IDRISI Geographic Information and Image Processing systems and other software – now incorporated in TerrSet Geospatial Monitoring and Modeling Software – that were used to produce images like the ones in the exhibit.
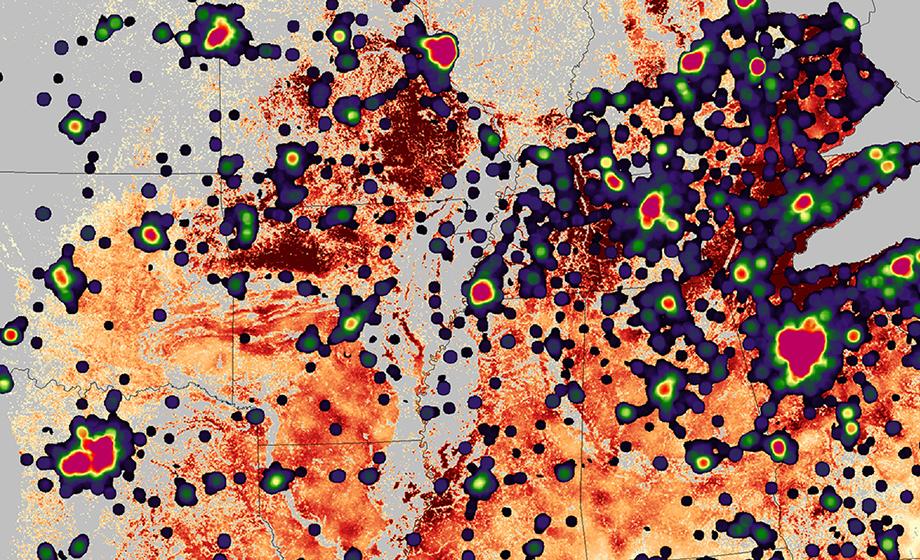
At first glance, the large-scale, brightly colored images appear to be abstract posters designed by a creative artist. But as Eastman describes it, each poster is a digital representation of multiple layers of data – including images gathered by earth observation satellites – that tell a complex story of how humans are transforming the earth.
It’s one thing to capture the images using GIS and image processing software; it’s another to analyze what they mean.
“Knowing the future is something humans have invested a lot into, and it’s something that’s not always easy, but we’re getting better at it,” Eastman said. “The computer was the important link.”
By coalescing and mapping the data, he and his graduate students are “looking for patterns because patterns given us a sense of process, and once we understand process, then we know how to predict,” Eastman said. “This is an interesting period of time because we have this ability to sense the environment on a continuing basis, literally a daily basis, and we have the opportunity to see these patterns, and they’re beautiful.”
The wide range of colors used in each image help scientists pinpoint the patterns; a singular image can be composed of hundreds of others pulled from satellite data over a period of time. In another recent presentation at Clark – for the 2016 Climate Change Teach-in – Eastman used satellite images of plant photosynthetic activity to demonstrate how they could be used to better understand global warming trends.
The images employ Clark Labs’ full suite of tools called TerrSet, including the IDRISI Geographic Information and Image Processing systems, the Land Change Modeler, the Habitat and Biodiversity Modeler and the Earth Trends Modeler.
“It’s an interesting time to be alive as a scientist,” Eastman said, “because not only can you learn some interesting insights into nature but you can also have fun doing it.”


